Software
GridSight
GridSight is a proposed energy-monitoring application that turns electrical measurements into understandable trends, summaries and reports.
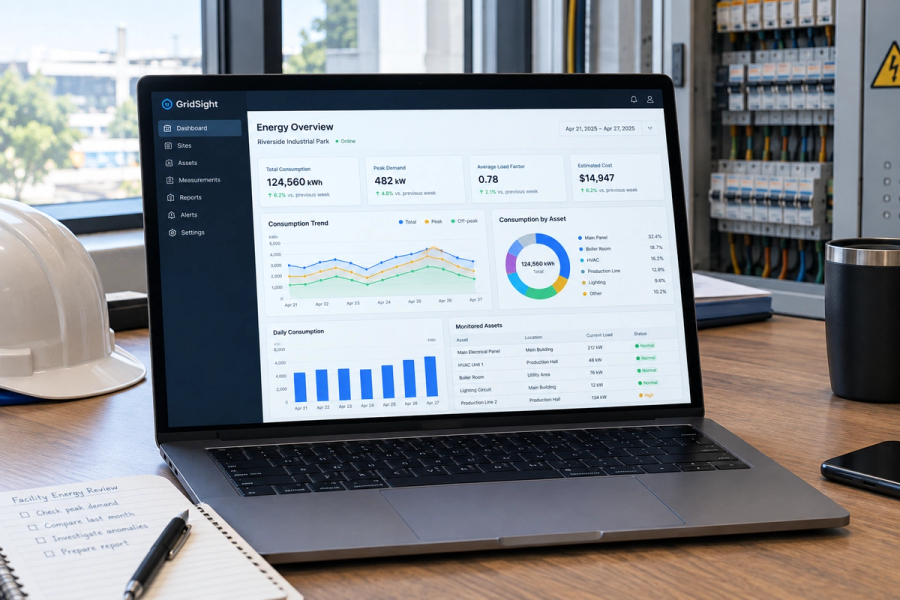
Electrical meters and monitoring devices can generate useful data, but raw readings are difficult to interpret when they are scattered across different devices, files or interfaces. GridSight is being developed to bring energy data into a single workspace where users can review consumption over time, compare measurement points and investigate unusual changes. Its focus is not simply displaying numbers, but making recorded electrical data useful for day-to-day operational decisions.
GridSight is envisioned as a software platform for collecting and interpreting data from compatible energy meters and monitoring devices. It would organize readings by site, asset or measurement point and present them through dashboards, historical charts and downloadable reports.
Users could review consumption patterns, compare periods, inspect changes in demand and configure notifications for selected conditions. Over time, the platform could help facilities teams identify unusual consumption and investigate whether changes relate to operating schedules, equipment behaviour or other factors.
The initial development priority would be importing or collecting measurement data, storing it consistently and presenting reliable historical views. Integration with specific meters and protocols would be added and documented only after implementation and testing.
GridSight is not intended to control electrical equipment, replace protective devices or guarantee energy savings. It cannot establish the cause of an abnormal reading from data alone. The quality of its analysis depends on measurement accuracy, data completeness and the context provided by the user.
Status
In development
Details
- Runs on
- Web browser (planned), Server environment to be determined
- Deployment
- Cloud, On-premise
What it does
- Organizes measurements by site and asset
- Displays energy consumption over time
- Compares historical measurement periods
- Visualizes demand and consumption trends
- Generates energy reports (planned)
- Flags configured measurement thresholds (planned)
Integrates with
- No meter, protocol or third-party platform integration has been verified yet. Compatibility should be added here only after the relevant connection has been implemented and tested.
Want to see it working?
Describe the process it would replace. Helena will say plainly whether this is the right tool, or whether the honest answer is that it is not built yet.